Here is an excellent guide (written by Mike Schouten of Componative) on using and configuring JConsole:
- Monitor Your Applications With JConsole - Part 1
- Monitor Your Applications With JConsole - Part 2
- Monitor Your Applications With JConsole - Part 3
I found Part 2 specially interesting, because it explained that JConsole uses 2 ports to connect to a remote JVM, and only one of them is configurable the other one is random, the way to detect it is to create a logging.properties file that looks something like this:
 handlers = java.util.logging.ConsoleHandler
 .level = INFO

 java.util.logging.ConsoleHandler.level = FINEST
 java.util.logging.ConsoleHandler.formatter = \
 		java.util.logging.SimpleFormatter

 // Use FINER or FINEST for javax.management.remote.level - FINEST is
 // very verbose...
 javax.management.level = FINEST
 javax.management.remote.level = FINER
Now we can start JConsole with the following command to enable detailed logging of the javax.management classes:
jconsole -J-Djava.util.logging.config.file=logging.properties
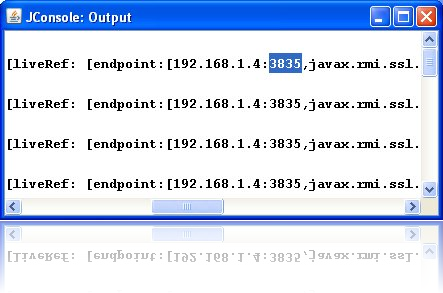
Connecting to the remote JVM will now result in the opening of a separate output window containing the detailed logging, in that output it is now possible to see the random port:

No comments:
Post a Comment